Email and Texting Reporting Tool
The email and texting reporting tool can be used to create a report showing the number of emails and texts sent using the output from DSLR Remote Pro and our other Windows based photo booth apps or from Breeze Booth for iPad.
Select "Photo booth sharing report..." from the Reports menu to run the email and texting reporting tool:
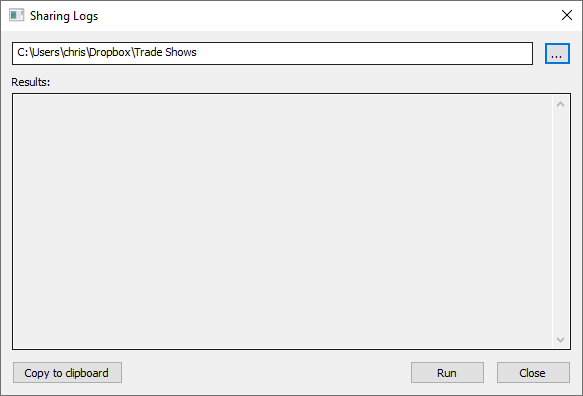
The email and text reporting tool works by scanning folder where the photo booth photos are saved looking for XML email and text files and reading this information to create a summary of the emails and texts. Enter the base folder in the edit box or press the "..." button to open a browser to select the folder. Then press the "Run" button to scan the folder and all its subfolders:
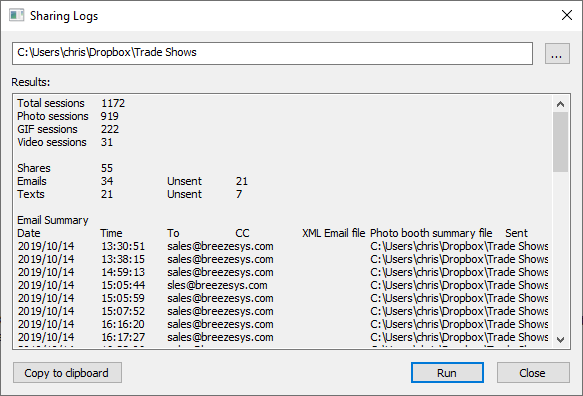
The results will show a summary of the total number of sessions and the breakdown between photos, GIFs and video sessions. It also shows the number of shares by email and by text.
This is followed by two tables: one showing email shares and one showing text shares. These tables use tab delimited fields which can be copied and pasted into a spreadsheet such as Microsoft Excel where the data can be displayed as a graph. A portion of the results can be selected by holding the left mouse button down and selected the required text or the whole report can be selected by clicking on the "Copy to clipboard" button. Then copy and paste the data into a spreadsheet for analysis.
The statistics tool can be used to create a report using the output from DSLR Remote Pro and our other Windows based photo booth apps or from Breeze Booth for iPad.
Select "Photo booth session stats report..." from the Reports menu to run the statistics tool:
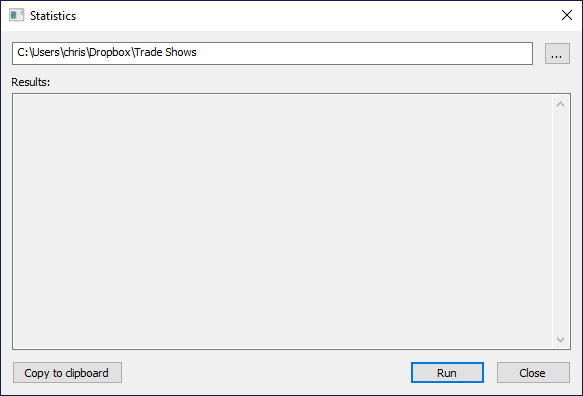
The statistics tool works by scanning folder where the photo booth photos are saved for XML summary files and reading this information to create a summary of the number of sessions and shares. Enter the base folder in the edit box or press the "..." button to open a browser to select the folder. Then press the "Run" button to scan the folder and all its subfolders:
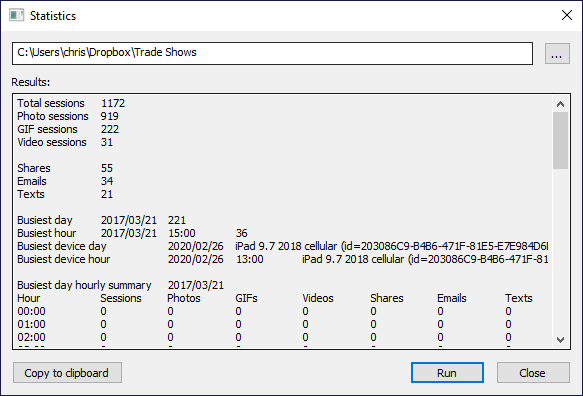
The results will show a summary of the total number of sessions and the breakdown between photos, GIFs and video sessions. It also shows the number of shares by email and by text.
The next session shows the busiest day and busiest hour for the period for all devices together with the busiest day and hour for a single device.
The busiest day is then shown as a table giving a hour by hour summary of the number and type of sessions and the shares.
Lastly, a table giving a day by day summary for the last 30 days is displayed showing the number and type of sessions and the shares.
These tables use tab delimited fields which can be copied and pasted into a spreadsheet such as Microsoft Excel where the data can be displayed as a graph. A portion of the results can be selected by holding the left mouse button down and selected the required text or the whole report can be selected by clicking the "Copy to clipboard" button. Then copy and paste the data into a spreadsheet for analysis.
The survey data tool can be used to create a report showing survey responses using the output from DSLR Remote Pro and our other Windows based photo booth apps or from Breeze Booth for iPad.
Select "Photo booth survey data report..." from the Reports menu to run the survey data tool:
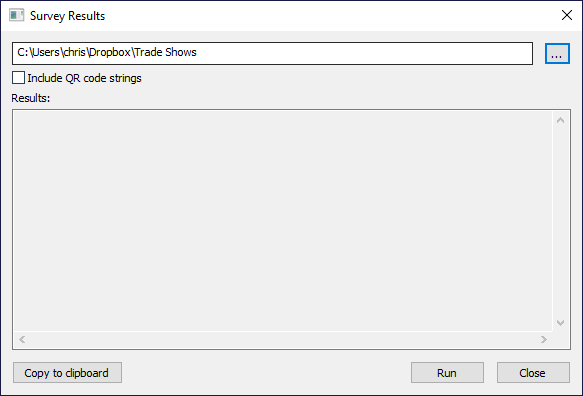
The survey data tool works by scanning folder where the photo booth photos are saved for XML summary files and reading this information to create a report showing responses to surveys. Enter the base folder in the edit box or press the "..." button to open a browser to select the folder. Select "Include QR code strings" to include data such as users' email addresses when using QR codes to run a contactless photo booth.
Then press the "Run" button to scan the folder and all its subfolders:
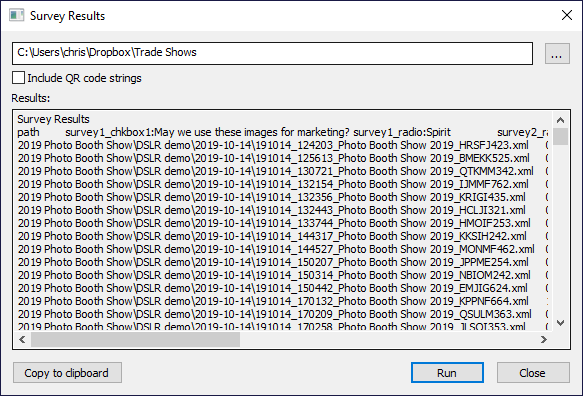
The results a table of each session that gathered survey data.
The first row of the table gives the headings for each column: 'path' for the path of the XML summary file followed by one or more headings for each of the survey results in the form: survey screen number (e.g. survey1), response type (e.g. chkbox, text or radio), response identifier.
The remaining rows show the responses to each session and start with the path of the XML summary file followed by a list of responses to each question in the survey.
The table uses tab delimited fields which can be copied and pasted into a spreadsheet such as Microsoft Excel where the data can be displayed as a graph or analysed. A portion of the results can be selected by holding the left mouse button down and selected the required text or the whole report can be selected by clicking the "Copy to clipboard" button. Then copy and paste the data into a spreadsheet for analysis.